Head Implant
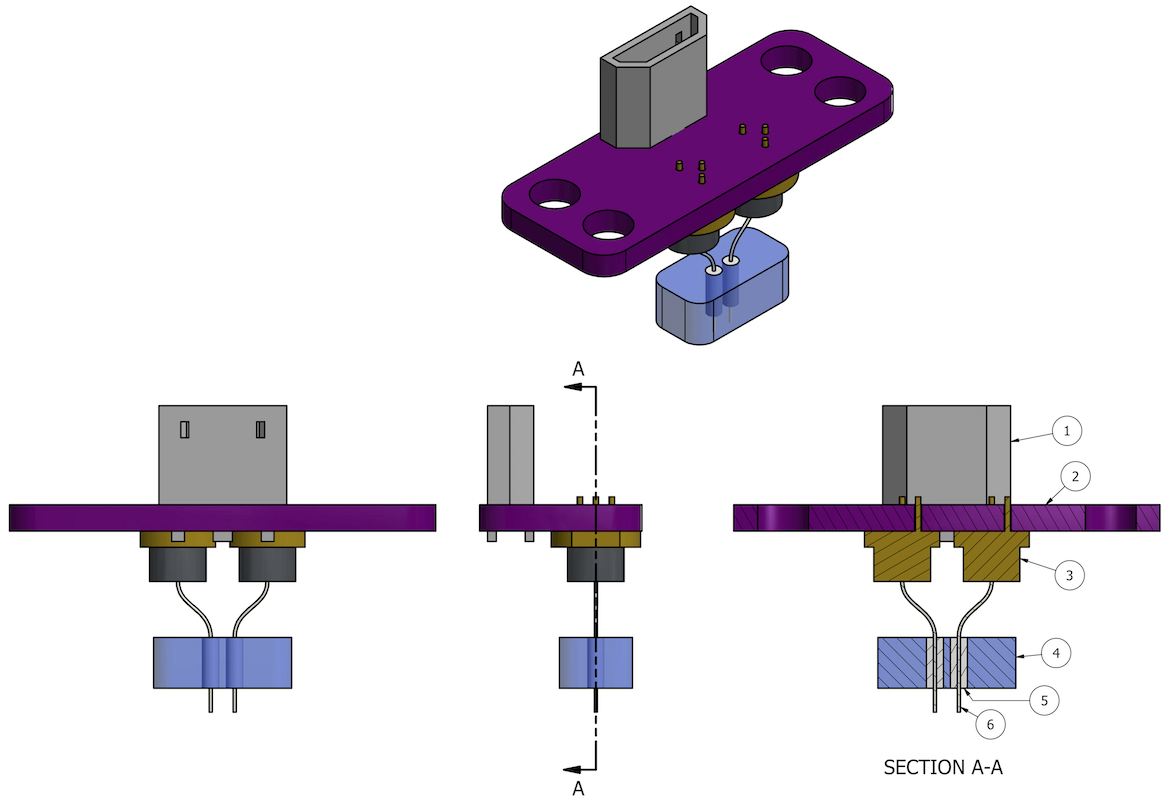
| Item | Description |
|---|---|
| 1 | Micro USB Socket |
| 2 | Printed Circuit Board (PCB) |
| 3 | Laser Diode |
| 4 | Acrylic fiber guide |
| 5 | Ferrule |
| 6 | Optical Fiber |
Required Tools
- Ruler
- Soldering iron
- Tweezers
- Fiber stripper
- Fiber cleaver
- 3-axis fiber launch system
- Power meter and photodiode sensor
- Ultraviolet light
Bill of Materials
| Qty | Description | Datasheet | Vendor |
|---|---|---|---|
| 1 | Implant PCB | OSH Park | |
| 2 | Laser Diodes | PL 520_B1 |
World Star Tech |
| 1 | Optical Fiber | FP200URT |
ThorLabs |
| 1 | Norland Optical Adhesive 68 | NOA 68 | Norland Products |
| 2 | Ferrule | MM-FER2007C-2500 |
Precision Fiber Products |
| 1 | Epoxy | T120-023-CX |
FIS |
| 1 | Liquid electric tape | Amazon | |
| 1 | Photoresistor | PDV-P9005-1 |
Octopart |
| 1 | Female micro USB vertical socket | 105133-001 |
|
| 1 | 0805 6.8 kΩ Resistor |
Design Files
Assembly Instructions
- Strip fiber and cut to length
- Align fiber to laser diode
- Apply Norland Optical Adhesive 68 and cure it with UV light
- Laser cut fiber guide
- Insert ferrules into acrylic to create fiber guide
- Thread coupled fibers through fiber guide
- Surround assembly with epoxy
- Place photoresistor in epoxy
- Cover photoresistor/epoxy with liquid electrical tape
- Solder laser diodes onto implant PCB
Diode Characterization and Pairing (for bilateral implants only)
Laser diodes are are not perfectly manufactured to have identical electrical characteristics. At a given current and voltage, there is some variation in light output from laser diode to laser diode. This can cause problems when making a bilateral implant because the current is split evenly between the two laser diodes. If the two laser diodes have drastically different electrical characteristics, this will result in one diode being brighter than the other. To try and prevent this unbalanced light ouput, we attempt to characterize each individual laser diode, and pair similar diodes together in each bilateral implant.
Instructions here.
Implant Characterization
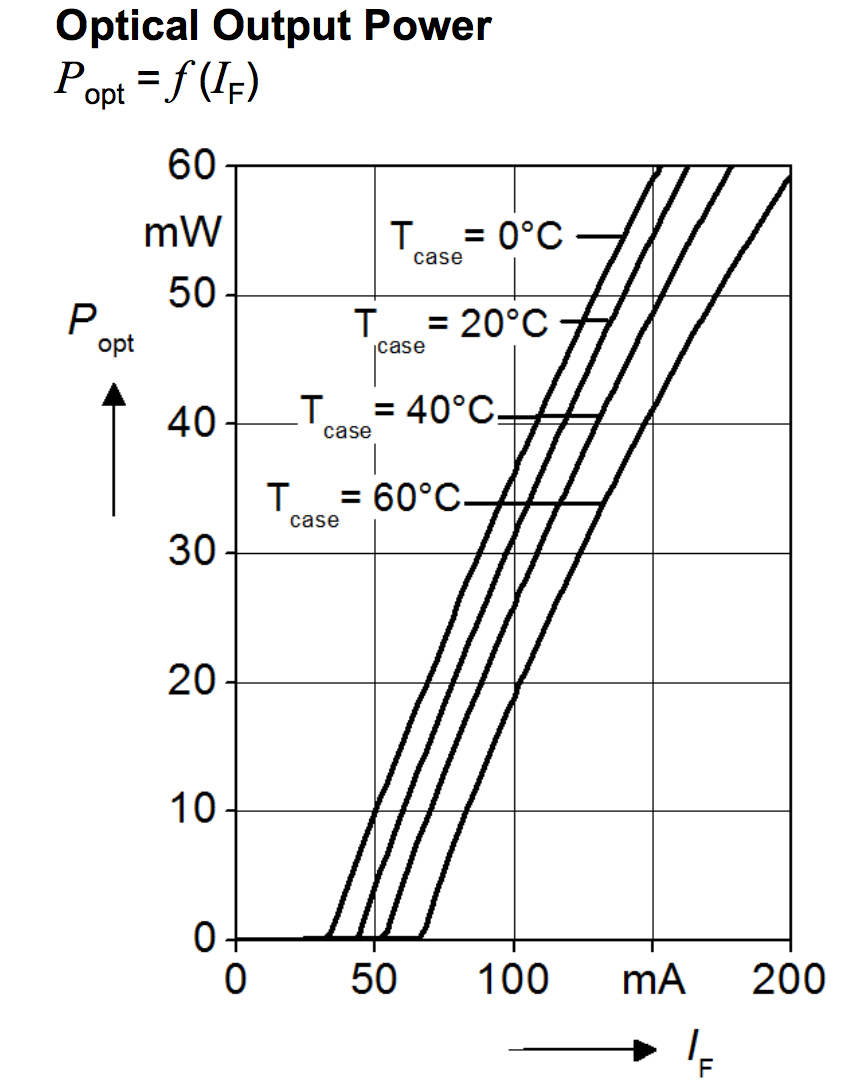
We want to know and be able to control the amount of light that we deliver to the brain during experiments. The light power produced by the laser diodes is a function of current and case temperature:
Cerebro has precise control of the current being delivered to the laser diode, and can monitor the voltage across the photoresistor. We can use a feeback loop to maintain a constant photoresistor voltage, and therefore a constant fiber tip light power output (assuming the light power at the fiber tip is proportional to the light hitting the photoresistor).
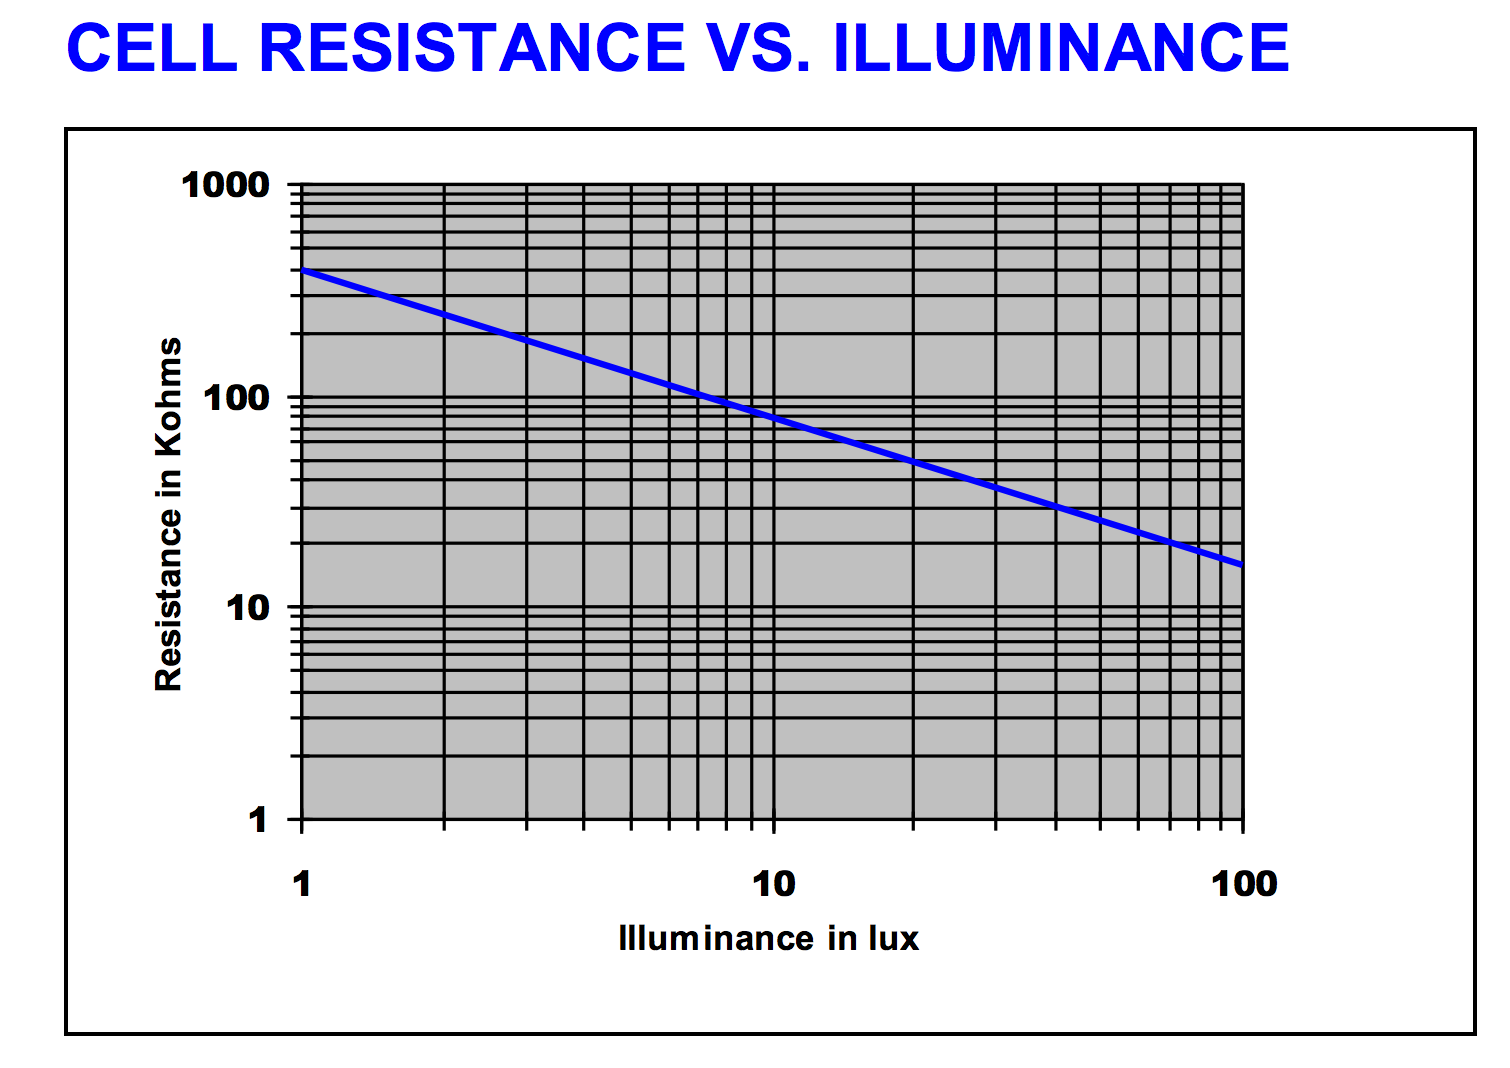
If the photoresistor had a linear response to light power, we could just make 1 measurement of the light output at a known photoresistor voltage and find a proportionality constant. However, the photoresistor doesn’t have a linear response:
We therefore need to measure the light output at the fiber tip across a range of known photoresistor voltages. Overall, we are trying to characterize the relationship between photoresistor voltage and fiber tip light power, resulting in a graph like the following:

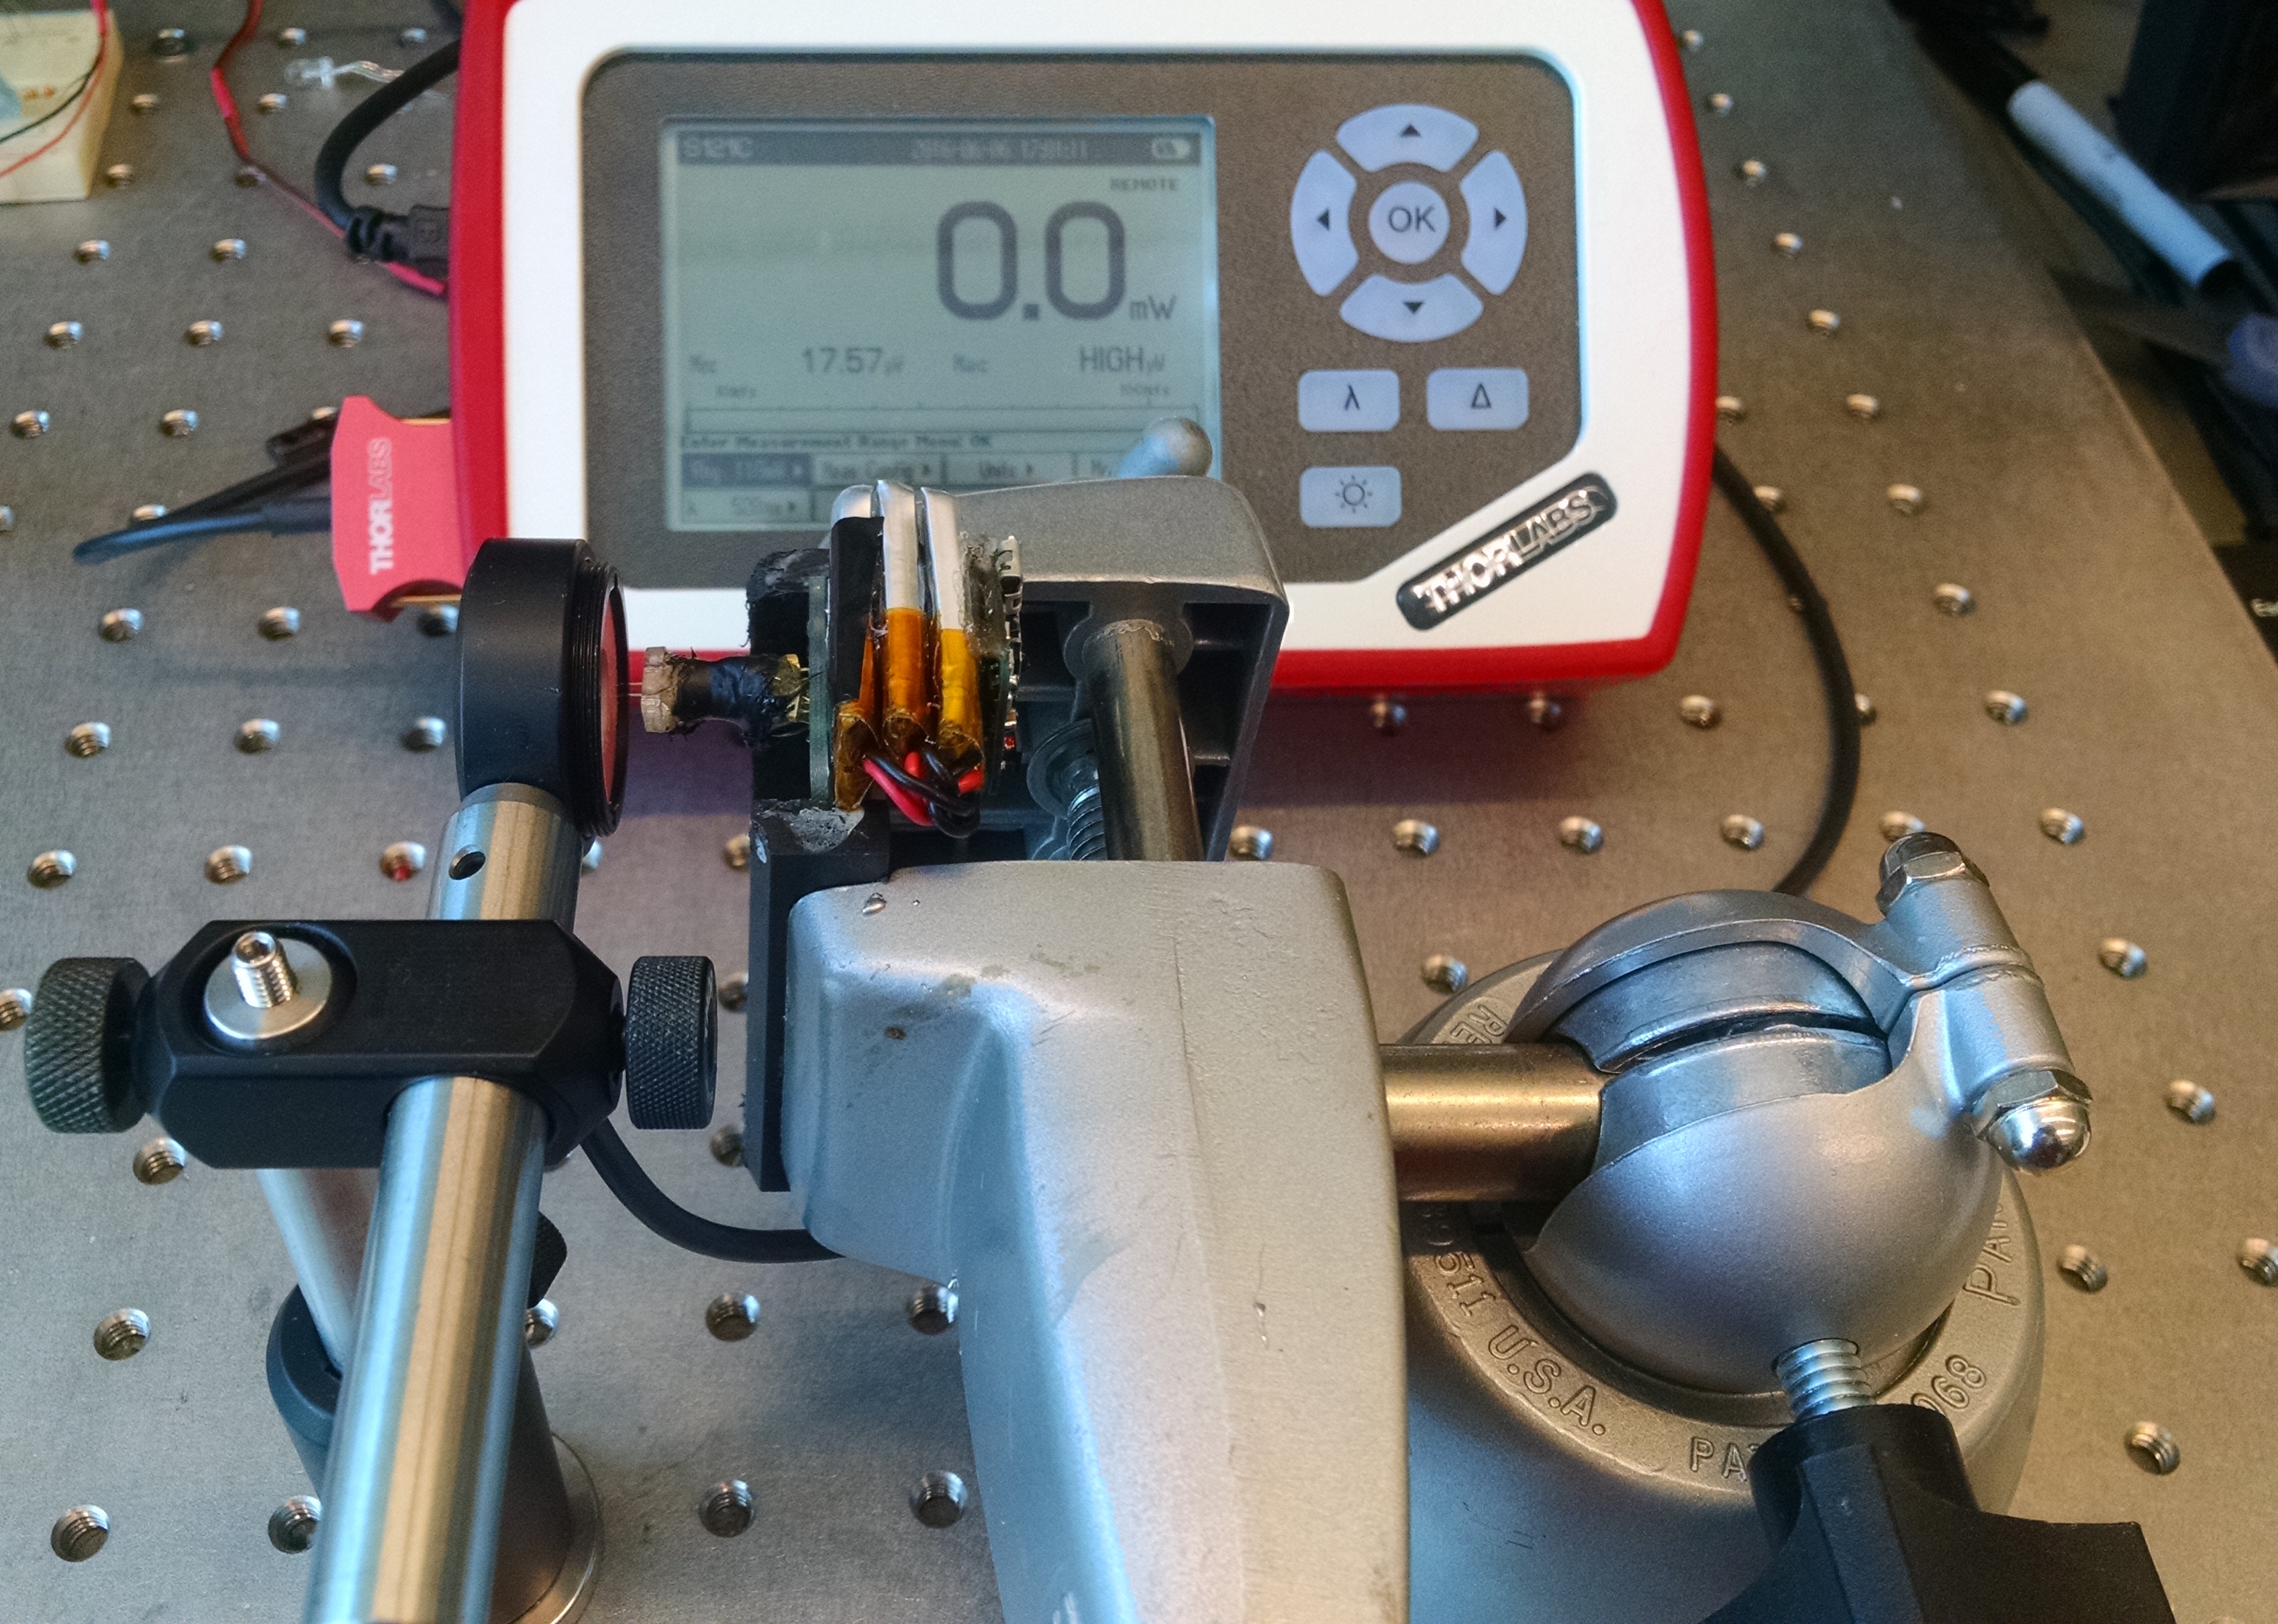
- Connect Cerebro to the Head Implant, and secure them in a test fixture with the fibers pointing into a Light Power Meter
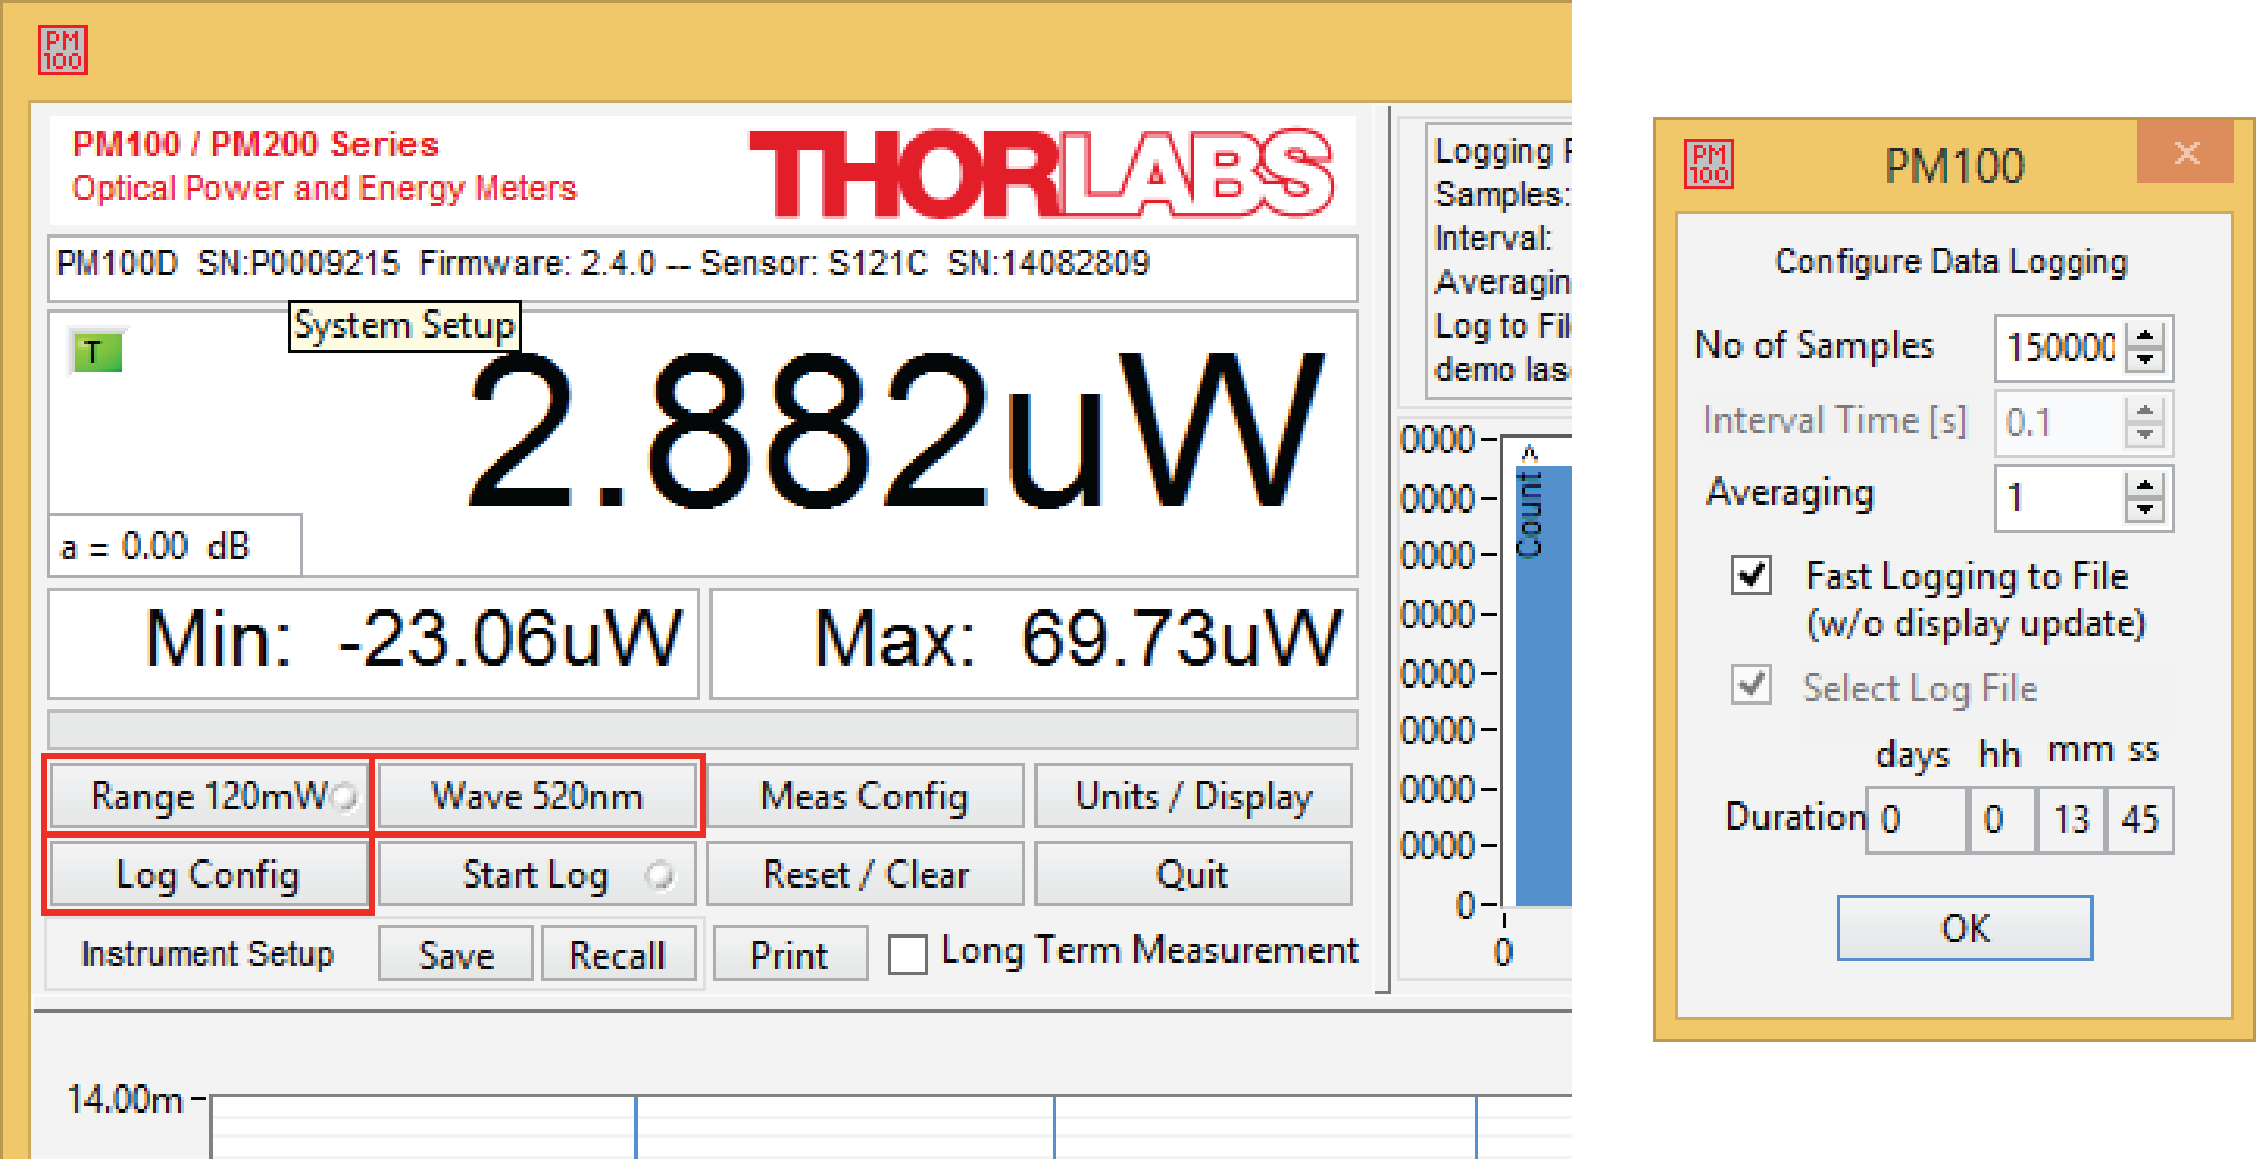
- Open up the Thorlabs’ Power Meter Software and change the following settings:
- Range: 120mW
- Wave: 520nm
- Log Configuration
- No of Samples: 150000
- Averaging: 1
- Fast logging to file: ✓
- Make sure Cerbero is turned on.
- Open up Xavier and start a new session. How to start a session
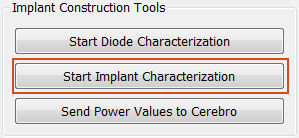
- In the “Cerebro’s Construction Tools” section click
Start Implant Characterization. Cerebro’s amber light will turn on to indicate that the characterization routine has begun.
- Within 10 seconds, click
Start Login the Light Power Meter software to begin recording light power data. - After about 15 minutes, the data will have been collected.
- When you are ready to setup a Cerebro for use with this implant, follow the instructions for sending power values to Cerebro